what is Homeownership Rate in US ? Rates by different state
When we look at the health of the American economy, the homeownership rate is often the most telling pulse. Is the “American Dream” still attainable, or is the nation shifting toward a permanent renter class? Using the latest data from USAFacts and the U.S. Census Bureau, we can break down where we stand today.
1. What is the National Homeownership Rate in the US?
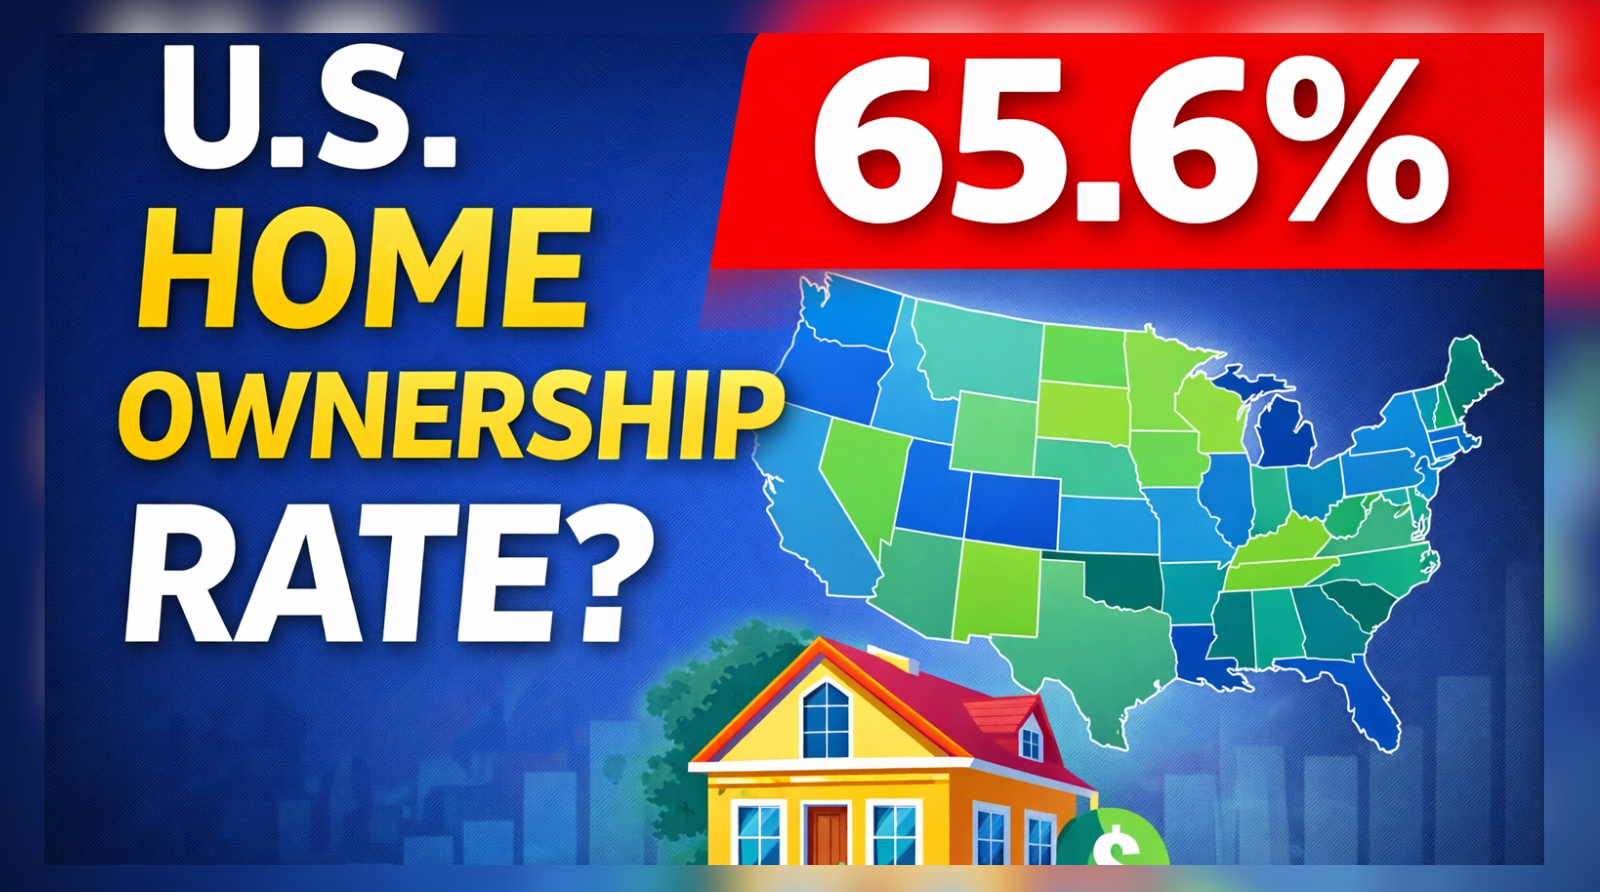
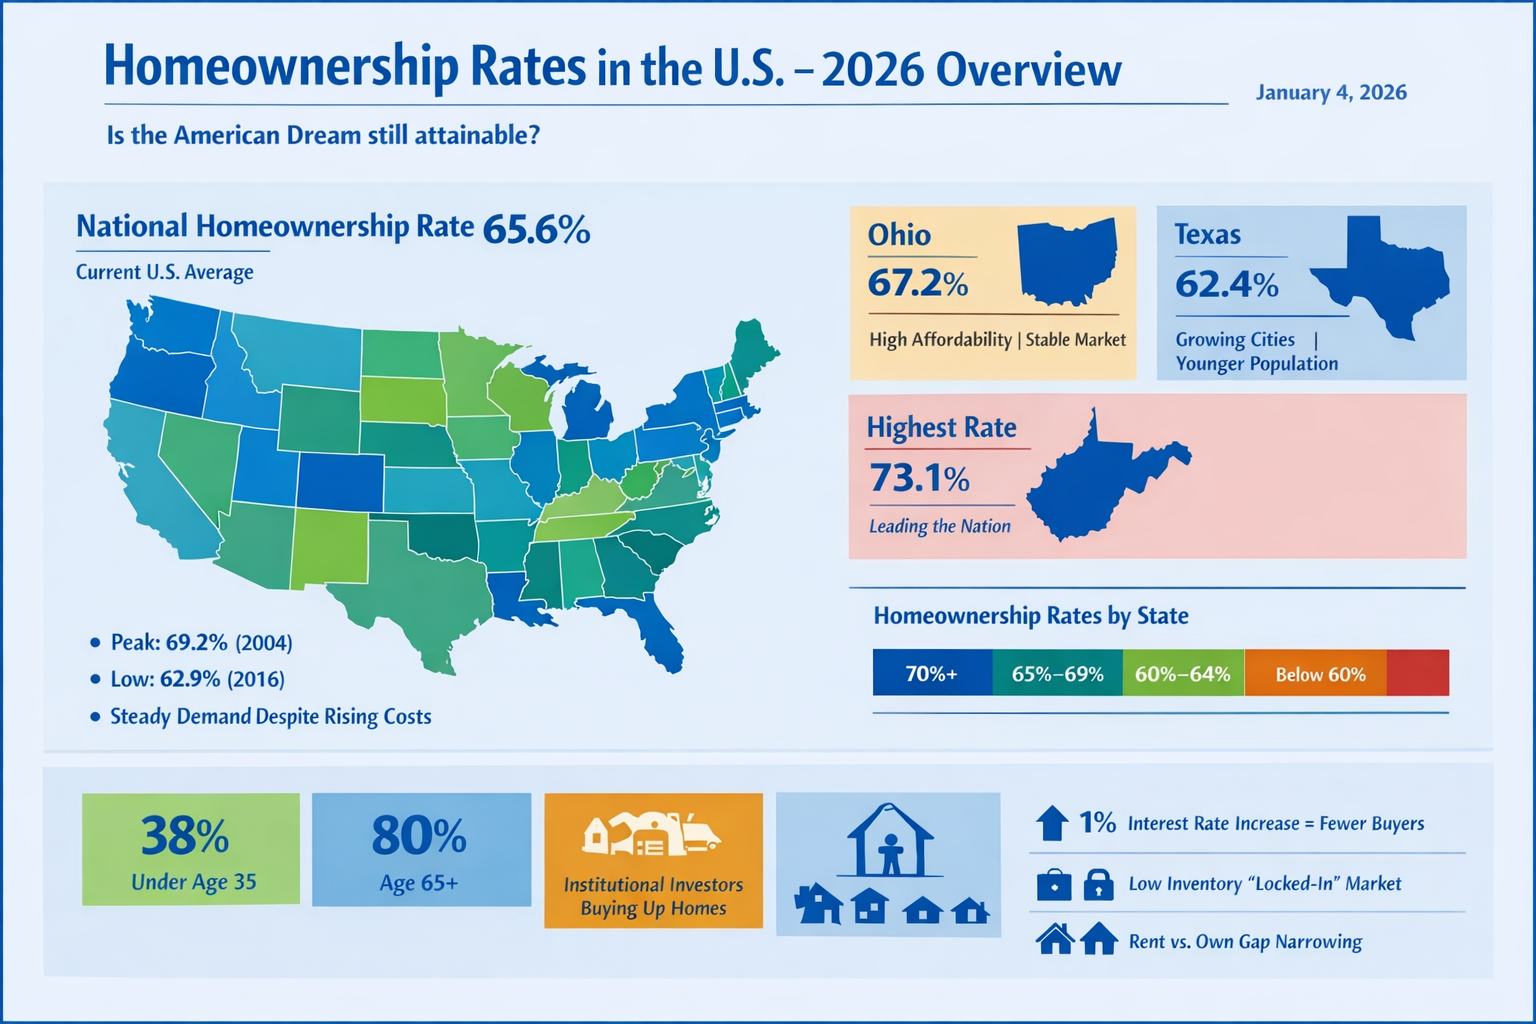
As of the most recent quarterly reports, the national homeownership rate in the United States is approximately 65.6%.
This figure has remained remarkably resilient despite fluctuating interest rates and rising inventory costs. Historically, this rate peaked at 69.2% in 2004 and hit a low of 62.9% in 2016. The current stability suggests that demand for homeownership remains high, even as the barrier to entry (affordability) increases.
2. What is the Homeownership Rate in Ohio? (USAFacts Data)
If you are looking for affordability and high ownership levels, the Midwest remains the champion. According to USAFacts, the homeownership rate in Ohio is approximately 67.2%.
Why Ohio Outperforms the National Average:
- Affordability Index: Ohio consistently ranks as one of the most affordable states for housing, particularly in the Dayton, Akron, and Toledo metros.
- Inventory Stability: Unlike the coastal markets, Ohio has a steady supply of older, “starter” homes that allow younger buyers to enter the market.
- Economic Mix: A diverse economy ranging from healthcare to manufacturing provides the stable, long-term employment required for 30-year mortgage approvals.
3. What is the Homeownership Rate in Texas? (USAFacts Data)
Texas is often seen as the land of expansion and growth, but its homeownership dynamics are slightly different. USAFacts reports that the homeownership rate in Texas is approximately 62.4%.
Why is Texas lower than Ohio?
It seems counterintuitive—Texas is building more homes than almost anywhere else. However, the lower percentage is driven by:
- Urbanization: Rapid growth in Austin, Dallas, and Houston has led to a massive influx of young professionals who prefer high-end apartment living in urban centers.
- Demographics: Texas has a younger median age than Ohio. Younger populations are statistically more likely to rent while they establish their careers.
- Price Appreciation: While still “affordable” compared to California, Texas home prices have spiked significantly since 2020, outpacing wage growth in several major metros.
4. Ohio vs. Texas: The Statistical Breakdown
| Metric | Ohio | Texas | US National |
|---|---|---|---|
| Homeownership Rate | 67.2% | 62.4% | 65.6% |
| Market Trend | Stable/Rising | Flat | Fluctuating |
| Primary Driver | Affordability | Population Growth | Interest Rates |
5. Factors Influencing Homeownership Rates in 2026
To understand these numbers, we have to look at the three “invisible” factors that USAFacts and the Census Bureau highlight:
- The Age Gap: Homeownership for those under 35 remains near 38%, while for those 65 and older, it sits at nearly 80%.
- The Supply Constraint: We are currently in a “locked-in” market. Homeowners with 3% mortgage rates from 2021 are refusing to sell, which keeps inventory low and prices high.
- Institutional Buying: In states like Texas, corporate investors have been buying up single-family homes to turn into rentals, which directly lowers the homeownership percentage.
6. FAQ
What state has the highest homeownership rate?
Typically, West Virginia holds the top spot with a rate often exceeding 73%, followed closely by states like Maine and Delaware.
What is the homeownership rate in Ohio?
The homeownership rate in Ohio is 67.2%, which is higher than the national average.
What is the homeownership rate in Texas?
The homeownership rate in Texas is 62.4%, largely due to a younger population and rapid urban growth.
Why is the homeownership rate decreasing in some cities?
High interest rates, the rise of institutional investors, and a lack of entry-level housing (starter homes) are the primary drivers for decreasing ownership rates in urban areas.
Is the US homeownership rate increasing?
No, it is currently in a “plateau” phase. While demand is high, the lack of inventory has kept the rate hovering between 65% and 66% for the last several years.
How does Ohio’s homeownership compare to the US average?
Ohio’s rate of 67.2% is roughly 1.6 percentage points higher than the US national average of 65.6%.
What is the primary barrier to homeownership in Texas?
Property taxes and rapid price appreciation in major metros like Austin and Dallas-Fort Worth are the biggest hurdles for Texas buyers.
Are more people renting or owning in 2026?
Nationally, more people still own (65.6%) than rent, but the gap is closing in high-growth states where apartment construction is outpacing single-family home starts.
How much do interest rates affect these percentages?
Significantly. A 1% rise in interest rates can disqualify millions of potential buyers, temporarily stalling the growth of the homeownership rate.
Where can I find the most accurate homeownership data?
The U.S. Census Bureau’s Current Population Survey (CPS) and USAFacts.org are the gold standards for verified, non-partisan housing data.